$107M
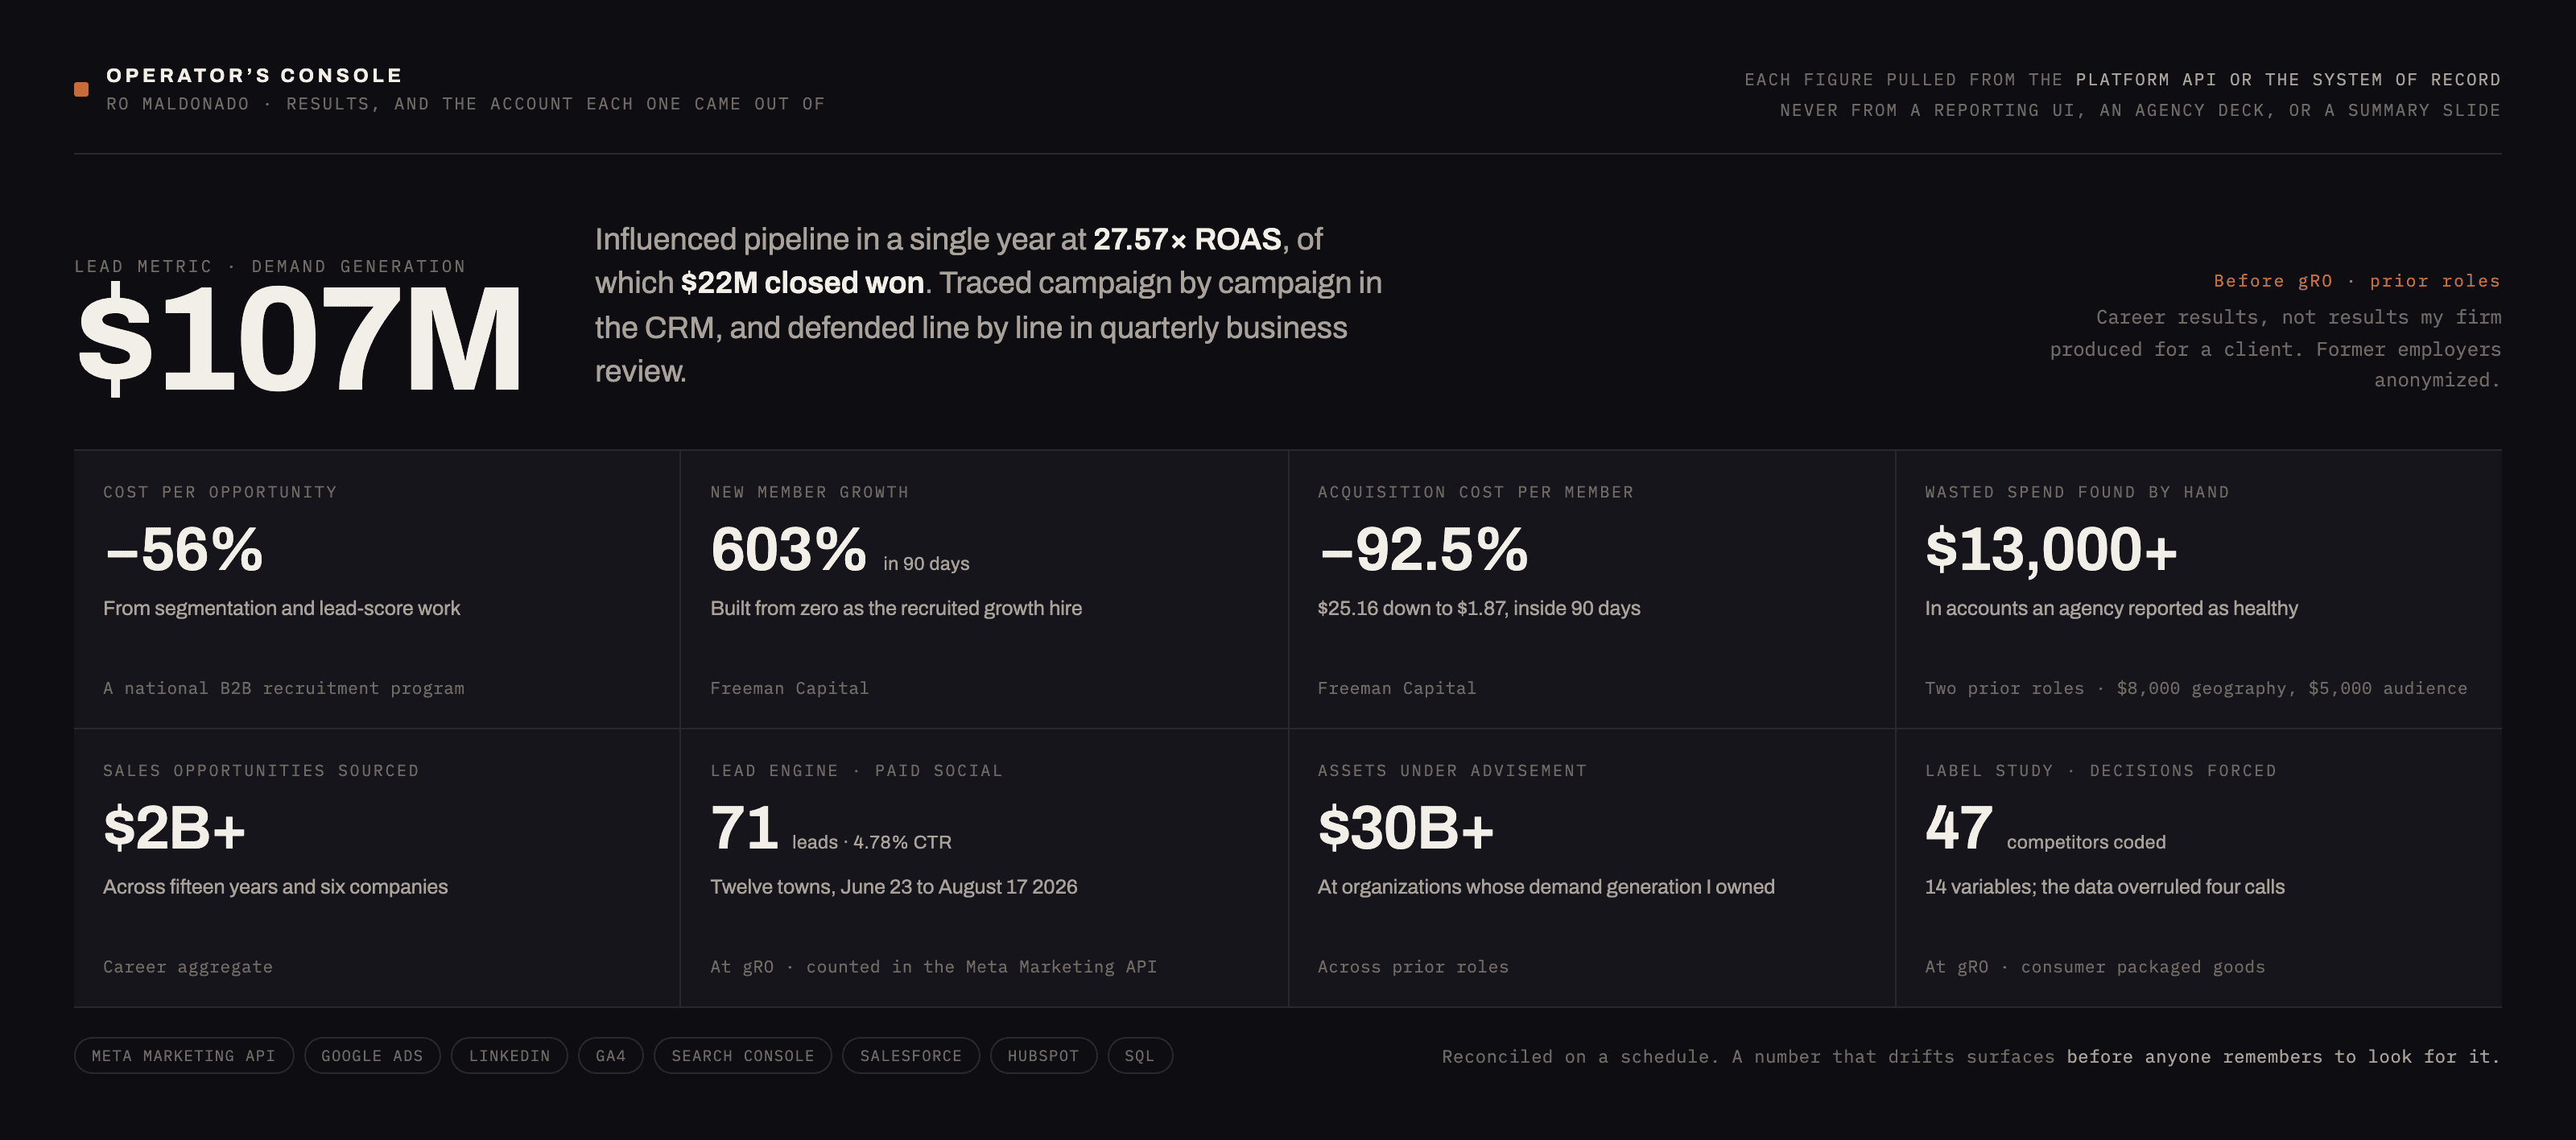
Influenced pipeline at 27.57× ROAS, $22M closed-won in a year
A national broker-dealer
Data & Analytics
Fifteen years reading marketing data inside the platform rather than on the summary slide someone built from it. Here is every analytics system I have operated with my own hands, what I did in each one, and the money it found.
GA4 · Tag Manager · Heap · Search Console · Meta Marketing API · Google Ads · LinkedIn · Salesforce · HubSpot · Marketo · Mautic · 6sense · Demandbase · SQL · Python · Node.js
Before gRO · prior roles · 15-year career
Why I read it by hand
A dashboard is built by someone who decided what to roll up and what to average away. That is where waste hides: not in a red cell, but inside a green one that covers four segments, one of which is on fire. So I open the account, pull the breakdown, and line the spend up against the pipeline it actually produced in the system of record. The platforms below are the ones I do that in.
The longer argument for working this way is on the analytics and forecasting page. This page is the inventory.
Three times the data disagreed with the deck
None of these were visible in a summary. All three were sitting in plain view one level down.
The campaign was supposed to be United States only. The agency had been serving ads to people on another continent, and more than $8,000 was gone before anyone noticed. Cost per click looked fine, so nothing in the reporting flagged it. The full story →
The customers opening accounts were 30 to 55 years old. The agency had set the paid audience to 18 to 24. Another $5,000 went to people who were never the buyer, and the impression numbers stayed healthy the whole time.
For a San Antonio salsa brand heading to the H-E-B shelf, I coded 47 competitor labels across 14 variables on a three-by-three placement grid, then rebuilt the flagship label against what the data said. It backed most of the intuitive placements and overruled four of them.
The instrument
This is how I keep the figures above honest. Every one of them is tied back to the account it came out of and the system it was counted in, because a number you cannot trace to a source is a number somebody else decided for you.
The stack
Not tools I have specified for someone else to run. Tools I have had open at eleven at night, with my own login, accountable to the number that came out of them.
01 · Measurement & behavior, before anything is built on it
Where the event data lives, and what I check before I let a decision rest on it.
Event-based measurement. I set the conversions and goals up myself, then read the channel and cohort breakdowns. That attribution read is what I argue a budget from.
Tag, trigger and dataLayer work. At Freeman Capital I collapsed three disconnected tools into one auditable reporting layer: HubSpot, Analytics and Tag Manager.
Retroactive event capture, so I can go back and ask what people did in the product after the fact. It is usually a different story from the funnel chart.
Query-level impression and click data. It is the only honest record of what an audience is typing, and I read it instead of the keyword tool’s estimate.
02 · Paid platform data, where the money moves
Reporting UIs summarize. The APIs behind them do not. I pull spend and delivery from the API before I quote any figure.
Campaign, delivery and cost data pulled straight from the API, never off the reporting UI. On a lead engine I built and ran at gRO: 71 leads at a 4.78% click-through rate across twelve towns, June 23 to August 17 2026, every count confirmed against the Meta Marketing API rather than the Ads Manager summary.
Search, Display and Video. I size demand in Keyword Planner rather than trusting a third-party volume estimate.
Account and job-title targeting for B2B demand generation. I reconcile the lead-form reporting against CRM myself.
03 · Systems of record, where a channel number meets the pipeline
A channel number only means something once it is matched to the pipeline it produced. That match happens here.
I co-authored the marketing-originated versus marketing-influenced attribution framework with Sales, then defended it in quarterly business reviews. Underneath that: campaign and pipeline reporting, lead scoring and CRM hygiene.
Lifecycle stages, workflow reporting and funnel conversion tracking. The nurture engagement data is the part I read closely: it shows where a sequence stops working.
Program and campaign reporting, and the segmentation underneath it. Lead scoring is only as good as the engagement data feeding it, so that is the part I read.
For OfferPath I standardized campaign reporting on two sources, Mautic and Google Analytics, and retired the send-count-only export for engagement metrics that describe what a send did.
04 · Intent data, for deciding where a program goes next
Third-party signal, so I can put a regional program where the demand is instead of spreading budget evenly and calling it coverage.
Account-level intent signal. I aimed the account-based campaigns at whichever segments it showed already in market.
Account identification and intent data. I fed it into multi-persona targeting inside a named-account program.
05 · Modeling, for when the platform cannot answer the question
I write the query myself. This is the part most marketing leaders hand to someone else.
I go at the store directly instead of waiting on a report. The gRO operating data sits in a SQL store I query and reconcile myself.
I write the pipelines, API pulls and scheduled jobs underneath the reporting: spend reconciliation, platform exports, and the checks that catch a number drifting.
I sized the total addressable market and built the predictive models across hundreds of thousands of records. The seasonality read out of that timed recruitment campaigns to the months when intent peaked.
I write the analysis and the thresholds; the agent fleet runs the pulls, the reconciliation and the alerting on a schedule, so a drifting number surfaces without anyone remembering to look.
Hand analytics to someone who has never spent the budget and you get a report that is accurate and useless. The person modeling the forecast has to be the person watching the money move.
Ro Maldonado · Founder, gRO
Credentials
The full list, including what is in progress, is on the certifications page.
Two reasons people read this page